3 - Basic Tests - Create Disc
This tab was introduced starting from the version 4.50 of CD-DVD Speed. Basically it's the same of the "classic" writing disc test of the Benchmark tab, but it allows the user to measure also some more data. In the classic test are showed only writing speed and disc rotation speed, whereas in the new test are showed also drive buffer and CPU utilization, both in the main window and in the plotted graph.
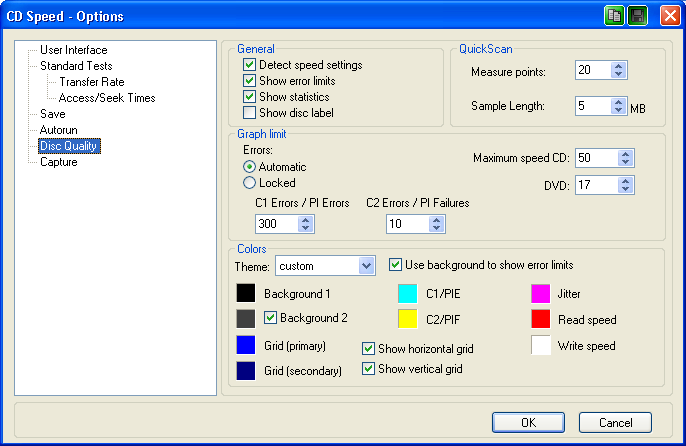
Line colors in the graph can be customized by the user, as already said in the options section of this guide.
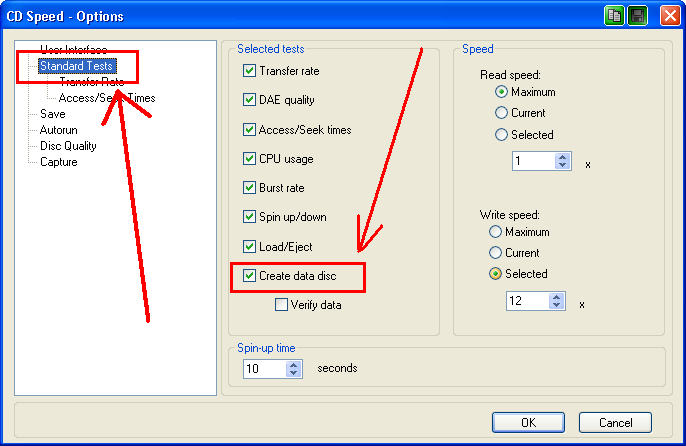
Important: All writing settings in global options of CD-DVD Speed are related to the "Classic" test of the "Benchmark" tab. Except for color settings, all options of the new create disc test are located in the "Create Disc" tab (see below for more details).
Important: To start this create disc test must be used the "Start" button. Using commands in the "Run Test" menu will be executed the "Classic" test, i.e. the one executed in "Benchmark" tab and the graph will be not showed if the tab "Create Disc" is selected.
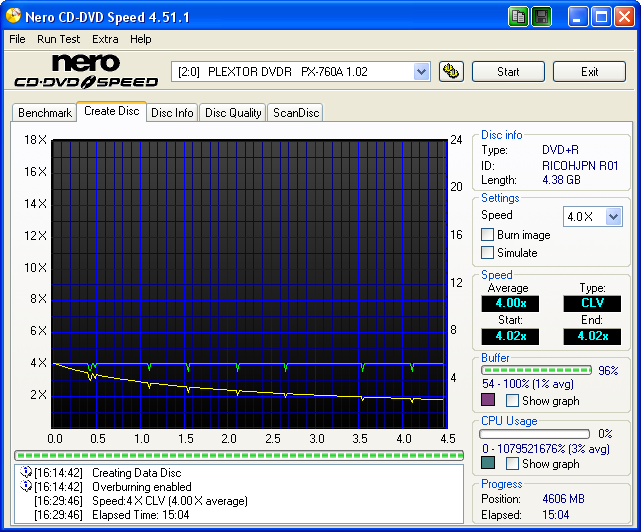
Create Disc main window

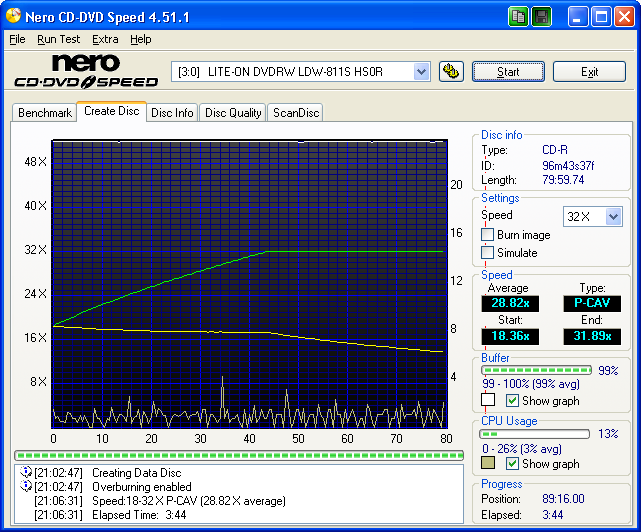
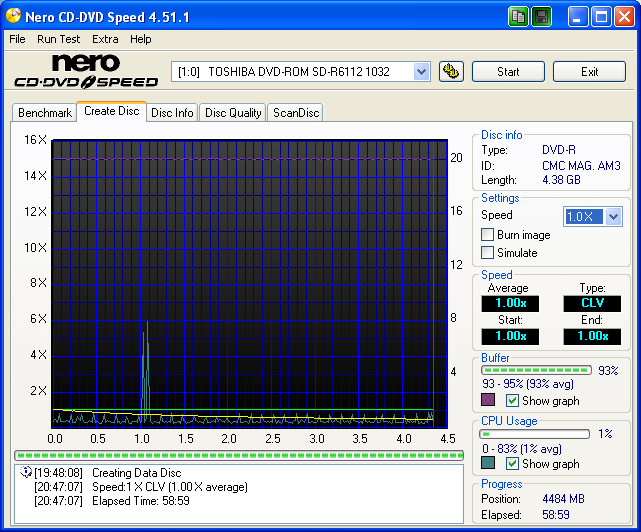
This interface is similar to the Benchmark one. In the upper part there is the combo box list to select the optical drive, the little button with gears to open global options, and two buttons, "Start" and "Exit".

Main part of the window contains the graph.

The scale on the left is writing speed, the scale on the right is disc rotation speed, and the scale in the bottom is disc capacity.
Under the graph there is a progression bar (green bar in the pic), and finally a little window showing some informations on the test.

On the right of the graph there is a panel with various options and informations.

Description of the right panel will be started from the higher part.
Disc info: Show the disc type (+R/RW, -R/RW, RAM), mediacode, and disc capacity.

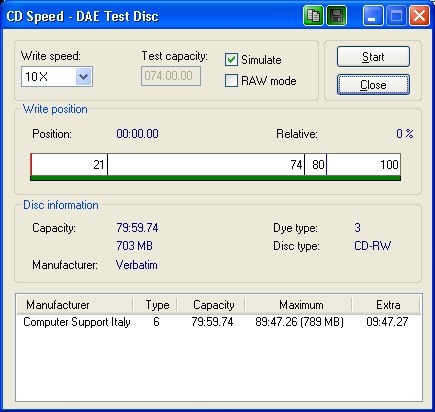
Settings: This panel contain options that user must set to execute Create Disc Test.

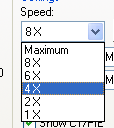
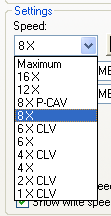
Speed: The writing speed that CD-DVD Speed must use to run test. Available speeds vary according the media used. These speeds are stored in burner firmware.
Burn Image: If this option is unchecked, CD-DVD Speed will write predefined binary data in a selectable number of files on a blank media.
Total file number written on the disc is variable, because data are written until the last sector which makes the disc very suitable to test the read performance, so a DVD will contain much more data than a CD media.
Because data is written until the last sector which makes the disc very suitable to test the read performance, if the user doesn't have an image file that matches the exact maximum capacity of a media (remember that +R and -R media have a slightly different maximum capacity), unchecking this option is the best way to test a disc at its full capacity.
During disc writing, a graph is drawn showing four curves: writing speed, disc rotation speed, buffer level, and CPU utilization.
If this option is checked, CD-DVD Speed will write the content of an image file created by the user. Supported types are ISO and NRG (the proprietary Nero Burning ROM image file format).
If this option is checked, after pressing the start button CD-DVD Speed will ask to select the image file to burn on the disc.

Writing test will start only after the image file is selected.
Simulate: If this option is checked, CD-DVD Speed will not write any data on the disc, but it will do a simulation. Even if writing it's not really done, CD-DVD Speed will record all parameters (writing speed, disc rotation speed, CPU utilization, and buffer level) and will create a complete graph.
If this option is unchecked, the disc will be written really.
Simulation can be useful to reveal bottleneck in the data speed transfer through the interface between computer and burner. This can happen, for example, if DMA is not enabled, or if the burner is connected through an IDE to USB (or firewire) adapter.
If data source is an image file, simulation can reveal too frequent buffer emptying due to a heavily fragmented hard disc.
Simulation can also reveal if there is an excessive CPU utilization. This can happen if DMA is not enabled or if there are some processes running in background during the burning (for example an antivirus).
Speed: In these boxes are shown the test results.

In the pic are shown there are two series of these boxes: on the left what appears before test start and on the right what appears after test end. Note that the first box initially show is named "Current", and at the end of the test is named "Average".
Current/Average: During test execution, this box shows current writing speed. At the end of test it shows average speed, calculated from start and end values (see below).
Type: The type of writing. The various types of writing (CLV, CAV. P-CAV, and Z-CLV) was already described in "Benchmark" section of this guide.
Start: Similarly to what is already described in "Benchmark" tab, start is the lowest speed recorded during test execution. Ideally it's the speed at which test started.
End: Similarly to what is already described in "Benchmark" tab, end is the highest speed recorded during test execution. Ideally it's the speed at which test ends.
Buffer: This panel show informations on buffer utilization during the writing test.

A horizontal bar shows graphically buffer status. Next to the bar is shown numerically (as percentage of filling) the buffer status.
Under the bar there are other numbers that refer respectively from left to right the minimum buffer level, the maximum buffer level, and the average buffer level. These values are updated continuously during the test execution.
The little colored square shows the color used to draw the buffer line in the graph. This color can be changed by the user in global options of CD-DVD Speed.
Show graph: By checking this option, the buffer graph will be drawn in the main window. Unchecking this option, buffer graph will be not drawn.
CPU Usage: This panel shows informations on CPU utilization during the writing test.

An horizontal bar shows graphically CPU utilization. Next to the bar is shown numerically the percentage of CPU utilization.
Under the bar there are other numbers that refer respectively from left to right the minimum CPU usage, the maximum CPU usage, and the average CPU usage. These values are updated continuously during the test execution.
The little colored square show the color used to draw the CPU usage line in the graph. This color can be changed by the user in global options of CD-DVD Speed.
Show graph: By checking this option, CPU usage graph will be drawn in the main window. Unchecking this option, CPU usage graph will be not drawn.
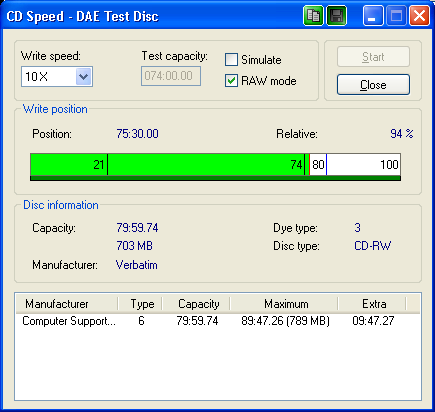
Progress: This panel shows in real time the current position of the disc during writing process, and the time past from the start of test.

Sidenote. Regarding times shown in this panel, there is a special consideration. If the user wants to burn an image file, (see later in "Test procedure"), the user must press the "Start" button, and then select the desired image file. Probably some people noted that after pressing the "Start" button, the time counter starts too. Don't worry: the time of the burning process will be measured only after the image file is selected. In fact, after selecting the image file, the time counter is resetted so the time shown here is the time required to complete the burning.
If the user wants to burn a binary data disc, the time starts after pressing the "Start" button.
Test Procedure
To execute the Create Disc test the procedure is as follows.
1) Select the drive to use to do the burn.

<br>
2) Set correctly all options, both global and specific options
3) Insert a media in the burner
4) Check again if local options (mostly if the burn image file option) are correct
5) Press the "Start" button
6) Wait until test is completed
7) Save results in HDD from menu "Save" or pressing the little floppy button (number 2 in the pic) to save a screenshot in PNG file.

This tab was introduced starting from the version 4.50 of CD-DVD Speed. Basically it's the same of the "classic" writing disc test of the Benchmark tab, but it allows the user to measure also some more data. In the classic test are showed only writing speed and disc rotation speed, whereas in the new test are showed also drive buffer and CPU utilization, both in the main window and in the plotted graph.
Line colors in the graph can be customized by the user, as already said in the options section of this guide.
Important: All writing settings in global options of CD-DVD Speed are related to the "Classic" test of the "Benchmark" tab. Except for color settings, all options of the new create disc test are located in the "Create Disc" tab (see below for more details).
Important: To start this create disc test must be used the "Start" button. Using commands in the "Run Test" menu will be executed the "Classic" test, i.e. the one executed in "Benchmark" tab and the graph will be not showed if the tab "Create Disc" is selected.
Create Disc main window

This interface is similar to the Benchmark one. In the upper part there is the combo box list to select the optical drive, the little button with gears to open global options, and two buttons, "Start" and "Exit".

Main part of the window contains the graph.
The scale on the left is writing speed, the scale on the right is disc rotation speed, and the scale in the bottom is disc capacity.
Under the graph there is a progression bar (green bar in the pic), and finally a little window showing some informations on the test.
On the right of the graph there is a panel with various options and informations.
Description of the right panel will be started from the higher part.
Disc info: Show the disc type (+R/RW, -R/RW, RAM), mediacode, and disc capacity.
Settings: This panel contain options that user must set to execute Create Disc Test.
Speed: The writing speed that CD-DVD Speed must use to run test. Available speeds vary according the media used. These speeds are stored in burner firmware.
Burn Image: If this option is unchecked, CD-DVD Speed will write predefined binary data in a selectable number of files on a blank media.
Total file number written on the disc is variable, because data are written until the last sector which makes the disc very suitable to test the read performance, so a DVD will contain much more data than a CD media.
Because data is written until the last sector which makes the disc very suitable to test the read performance, if the user doesn't have an image file that matches the exact maximum capacity of a media (remember that +R and -R media have a slightly different maximum capacity), unchecking this option is the best way to test a disc at its full capacity.
During disc writing, a graph is drawn showing four curves: writing speed, disc rotation speed, buffer level, and CPU utilization.
If this option is checked, CD-DVD Speed will write the content of an image file created by the user. Supported types are ISO and NRG (the proprietary Nero Burning ROM image file format).
If this option is checked, after pressing the start button CD-DVD Speed will ask to select the image file to burn on the disc.
Writing test will start only after the image file is selected.
Simulate: If this option is checked, CD-DVD Speed will not write any data on the disc, but it will do a simulation. Even if writing it's not really done, CD-DVD Speed will record all parameters (writing speed, disc rotation speed, CPU utilization, and buffer level) and will create a complete graph.
If this option is unchecked, the disc will be written really.
Simulation can be useful to reveal bottleneck in the data speed transfer through the interface between computer and burner. This can happen, for example, if DMA is not enabled, or if the burner is connected through an IDE to USB (or firewire) adapter.
If data source is an image file, simulation can reveal too frequent buffer emptying due to a heavily fragmented hard disc.
Simulation can also reveal if there is an excessive CPU utilization. This can happen if DMA is not enabled or if there are some processes running in background during the burning (for example an antivirus).
Speed: In these boxes are shown the test results.
In the pic are shown there are two series of these boxes: on the left what appears before test start and on the right what appears after test end. Note that the first box initially show is named "Current", and at the end of the test is named "Average".
Current/Average: During test execution, this box shows current writing speed. At the end of test it shows average speed, calculated from start and end values (see below).
Type: The type of writing. The various types of writing (CLV, CAV. P-CAV, and Z-CLV) was already described in "Benchmark" section of this guide.
Start: Similarly to what is already described in "Benchmark" tab, start is the lowest speed recorded during test execution. Ideally it's the speed at which test started.
End: Similarly to what is already described in "Benchmark" tab, end is the highest speed recorded during test execution. Ideally it's the speed at which test ends.
Buffer: This panel show informations on buffer utilization during the writing test.
A horizontal bar shows graphically buffer status. Next to the bar is shown numerically (as percentage of filling) the buffer status.
Under the bar there are other numbers that refer respectively from left to right the minimum buffer level, the maximum buffer level, and the average buffer level. These values are updated continuously during the test execution.
The little colored square shows the color used to draw the buffer line in the graph. This color can be changed by the user in global options of CD-DVD Speed.
Show graph: By checking this option, the buffer graph will be drawn in the main window. Unchecking this option, buffer graph will be not drawn.
CPU Usage: This panel shows informations on CPU utilization during the writing test.
An horizontal bar shows graphically CPU utilization. Next to the bar is shown numerically the percentage of CPU utilization.
Under the bar there are other numbers that refer respectively from left to right the minimum CPU usage, the maximum CPU usage, and the average CPU usage. These values are updated continuously during the test execution.
The little colored square show the color used to draw the CPU usage line in the graph. This color can be changed by the user in global options of CD-DVD Speed.
Show graph: By checking this option, CPU usage graph will be drawn in the main window. Unchecking this option, CPU usage graph will be not drawn.
Progress: This panel shows in real time the current position of the disc during writing process, and the time past from the start of test.
Sidenote. Regarding times shown in this panel, there is a special consideration. If the user wants to burn an image file, (see later in "Test procedure"), the user must press the "Start" button, and then select the desired image file. Probably some people noted that after pressing the "Start" button, the time counter starts too. Don't worry: the time of the burning process will be measured only after the image file is selected. In fact, after selecting the image file, the time counter is resetted so the time shown here is the time required to complete the burning.
If the user wants to burn a binary data disc, the time starts after pressing the "Start" button.
Test Procedure
To execute the Create Disc test the procedure is as follows.
1) Select the drive to use to do the burn.

<br>
2) Set correctly all options, both global and specific options
3) Insert a media in the burner
4) Check again if local options (mostly if the burn image file option) are correct
5) Press the "Start" button
6) Wait until test is completed
7) Save results in HDD from menu "Save" or pressing the little floppy button (number 2 in the pic) to save a screenshot in PNG file.






Comment